ACS Monitor Know what's broken before your customers call.
ACS Monitor is a self-hosted network and infrastructure monitoring platform built by MSPs, for MSPs. SNMP polling, service checks, auto-discovery, custom dashboards, and multi-channel alerting — all from a single one-command install.
Deploy in minutes, monitor everything, and catch issues early — without the complexity of traditional tools.
Built for real-world MSP environments. No credit card required.
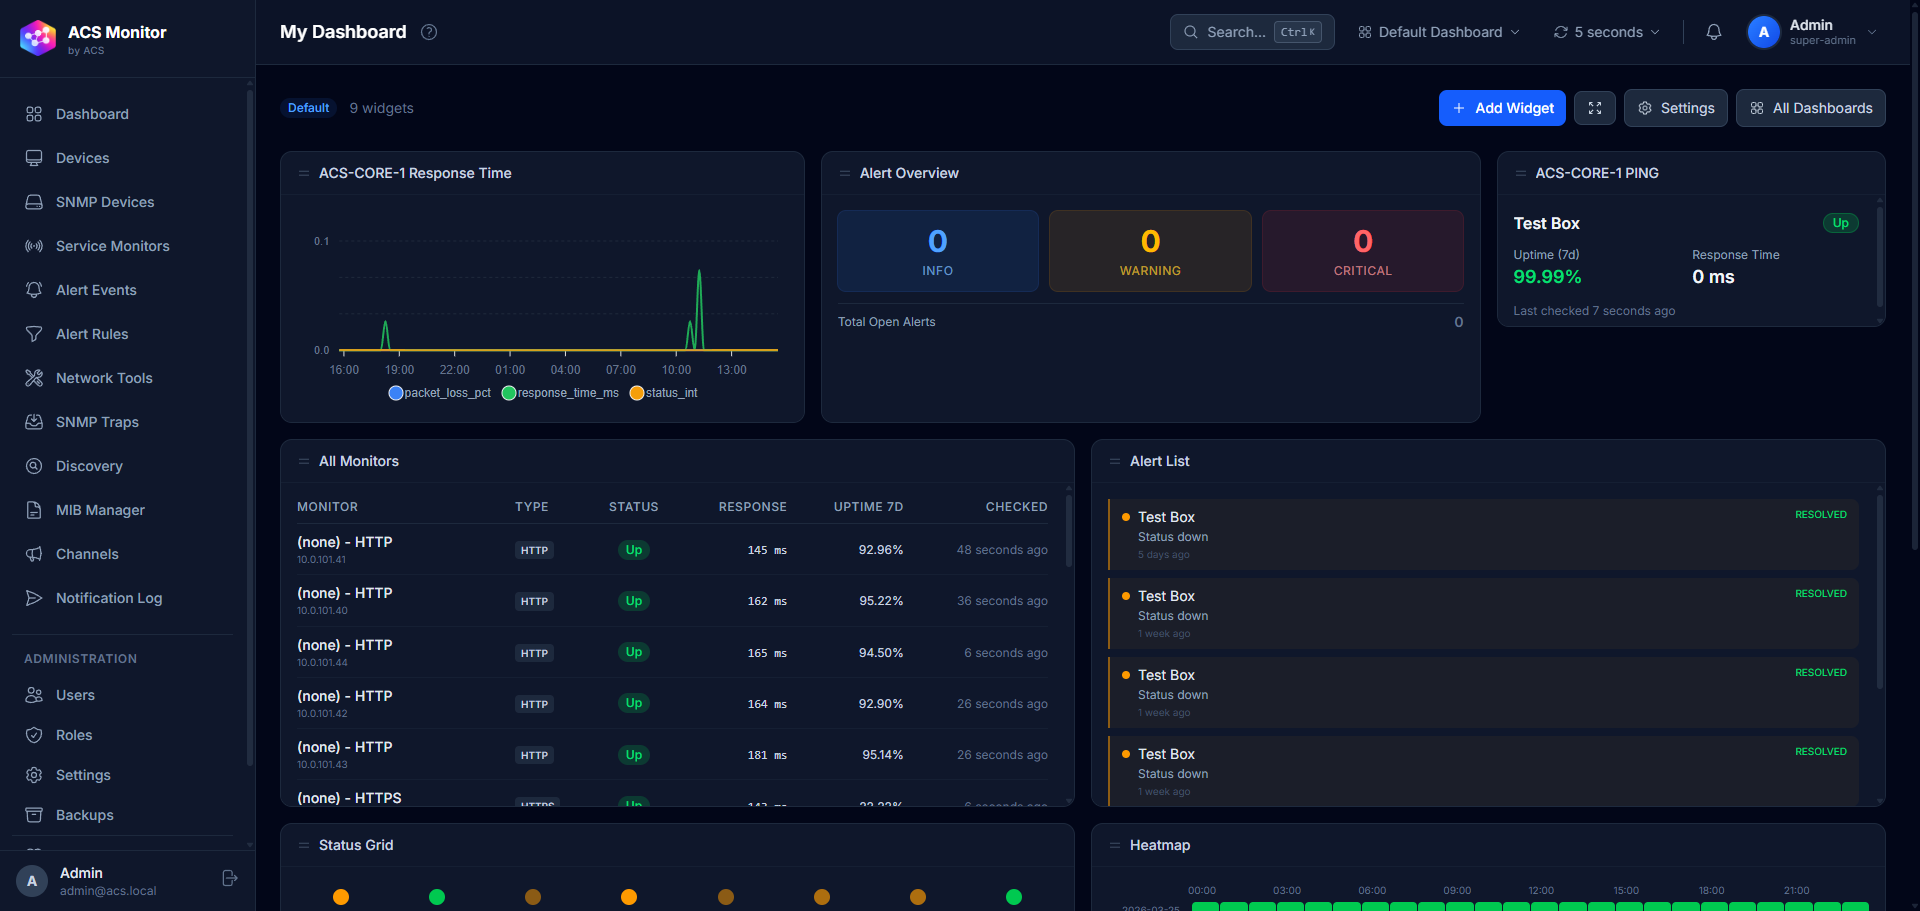
Know a site is failing before your customer calls
Smart thresholds, consecutive failure checks, and multi-channel alerts mean you hear about problems first -- not from a frustrated client on the phone.
One install, one dashboard, every client
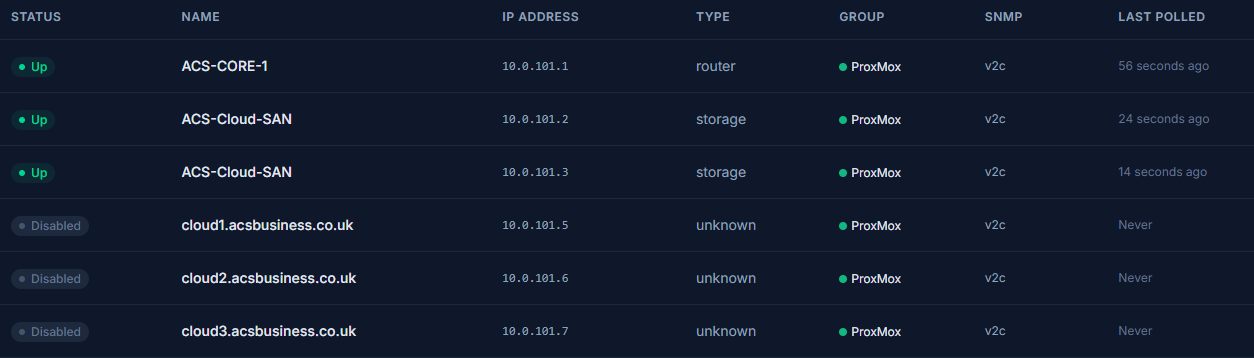
SNMP devices, service monitors, and network health across all your clients in one place. Scoped views keep everything separated.
From zero to monitoring in under 10 minutes
One command installs everything. All services configured, monitoring running, and ready before your coffee gets cold.
Alerts that actually tell you what's wrong
Device, metric, threshold, and severity in every alert. Recovery notifications when it's resolved. Delivered via email, SMS, Slack, or webhooks.
Designed for real MSP headaches
Every feature exists because we hit the same problems you do. Here is how ACS Monitor fixes them.
The problem
Customers calling before your alerts fire
The fix
Smart thresholds with consecutive failure checks eliminate false positives. You get alerted when something is genuinely wrong -- before anyone else notices.
The problem
Jumping between three tools to find what's broken
The fix
SNMP polling, service monitors, and network diagnostics in one place. No more tabbing between platforms to piece together what went wrong.
The problem
Spending half a day setting up monitoring for a new client
The fix
One command. Done in minutes. The installer handles everything, and auto-discovery finds devices and services on the network automatically.
The problem
Dashboards that look great but don't actually help
The fix
25 widget types designed for the data you actually need. Status grids, alert feeds, throughput charts, SSL trackers -- all drag-and-drop, all real-time.
One platform. Everything you need.
SNMP, service checks, dashboards, alerting, and network tools -- all in one place, all self-hosted.
Stop juggling tools just to see what's broken
SNMP polling, service checks, website monitoring, and auto-discovery in one platform. No more switching between three different tools to get the full picture of a client's network.
- SNMP v1/v2c/v3 with custom OID polling and MIB resolution
- 11 monitor types: HTTP, Ping, TCP, SSH, DNS, SMTP, FTP, POP3, IMAP, MySQL, HTTPS
- Website monitoring: track uptime, response times, SSL expiry, and content changes across client sites
- Auto-discovery: ping sweep, SNMP probe, and service detection in one scan
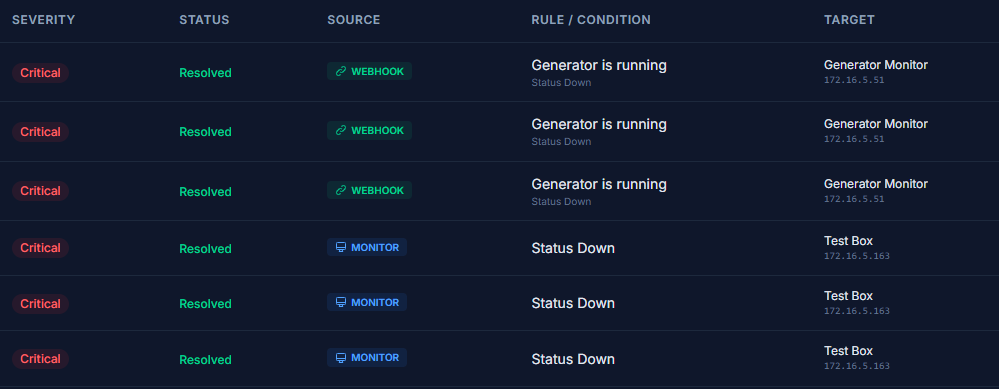
Know exactly what's wrong, not just that something is
Every alert includes the device, IP address, metric, threshold breached, and severity level. When the issue resolves, you get a recovery notification with both the trigger and resolution timestamps. Consecutive failure checks prevent false alarms -- you only get woken up when it actually matters.
- Threshold rules with consecutive failure counts to prevent false alarms
- Multi-channel delivery: email, SMS, Slack, and custom webhooks
- Auto-escalation, acknowledge workflow, and recovery notifications
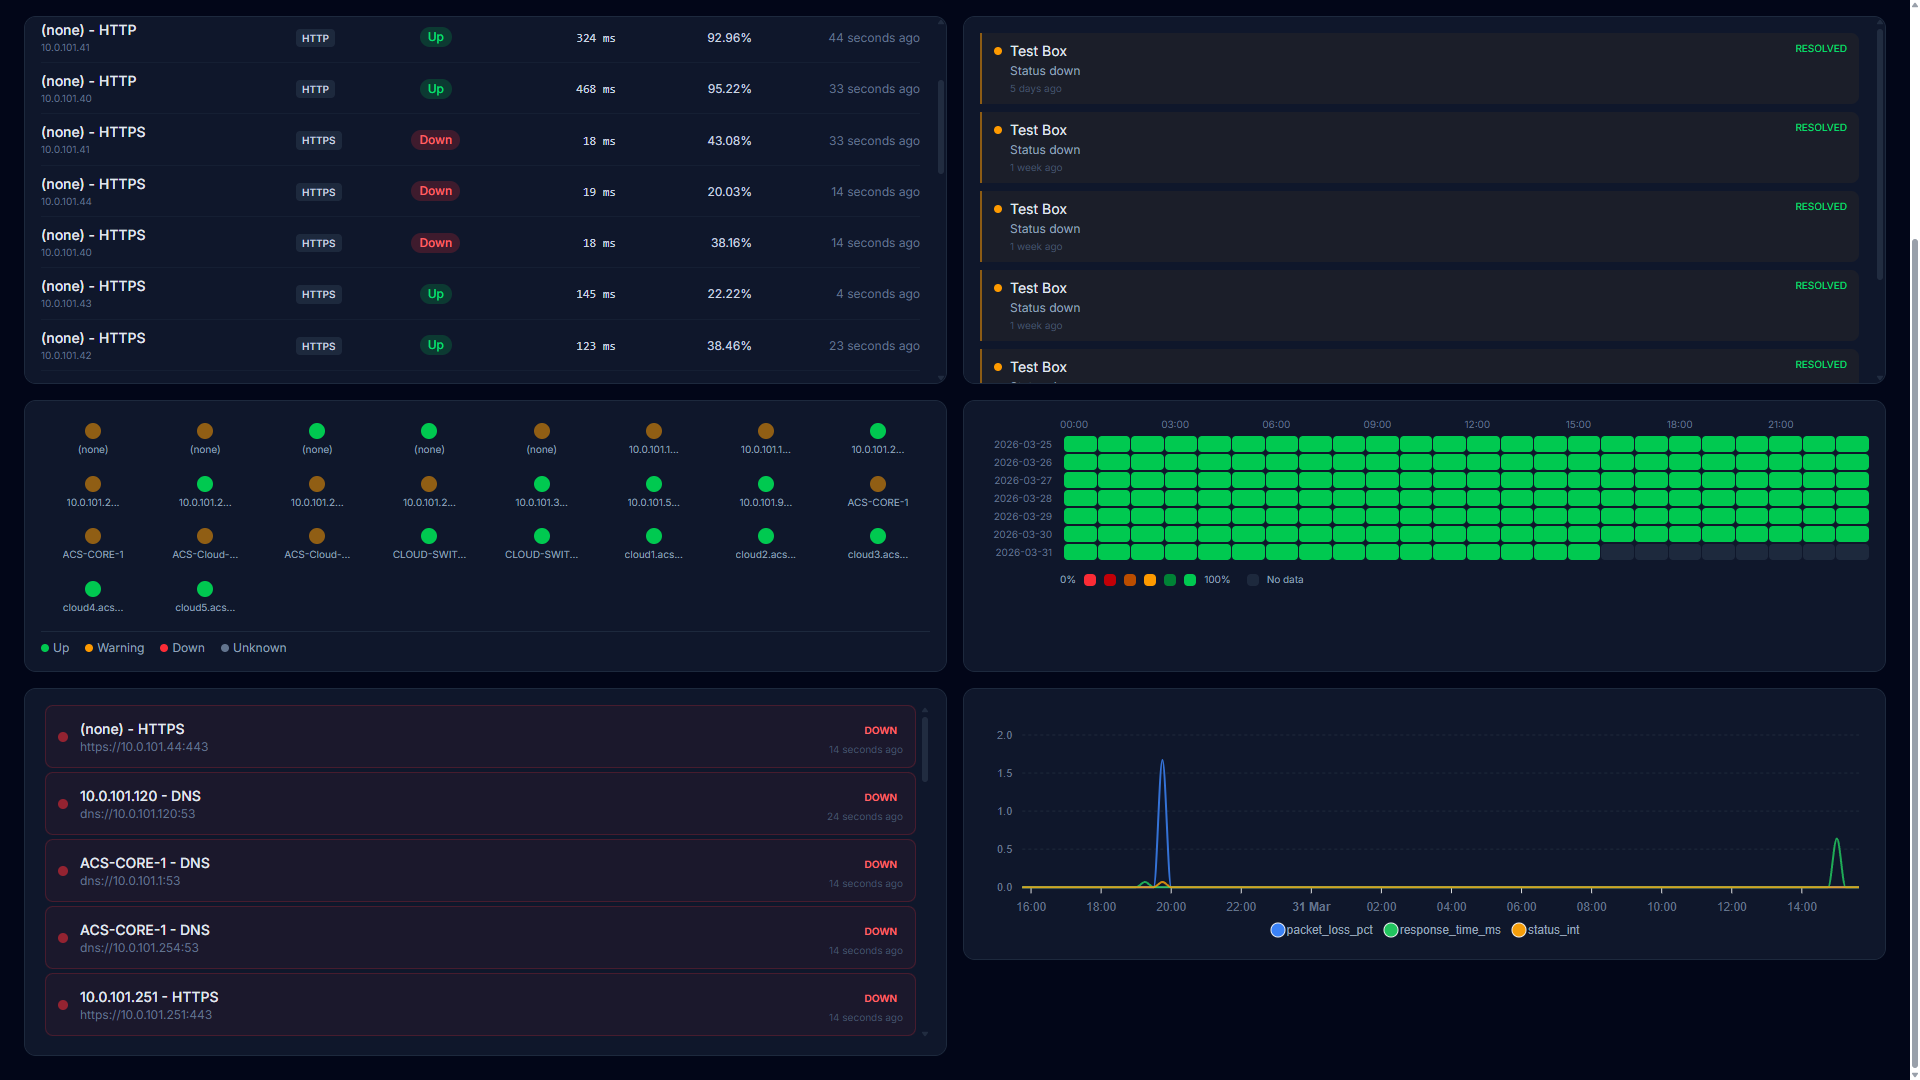
Dashboards that actually help you work
Not eye candy -- practical layouts with the data you need to make decisions. 25 widget types, drag-and-drop, auto-refreshing, and shareable with clients via a single link.
- Charts, gauges, grids, heatmaps, status cards, SSL trackers, and more
- Drag-and-drop layout with auto-saving positions
- Shareable via unique link -- no login required for viewers
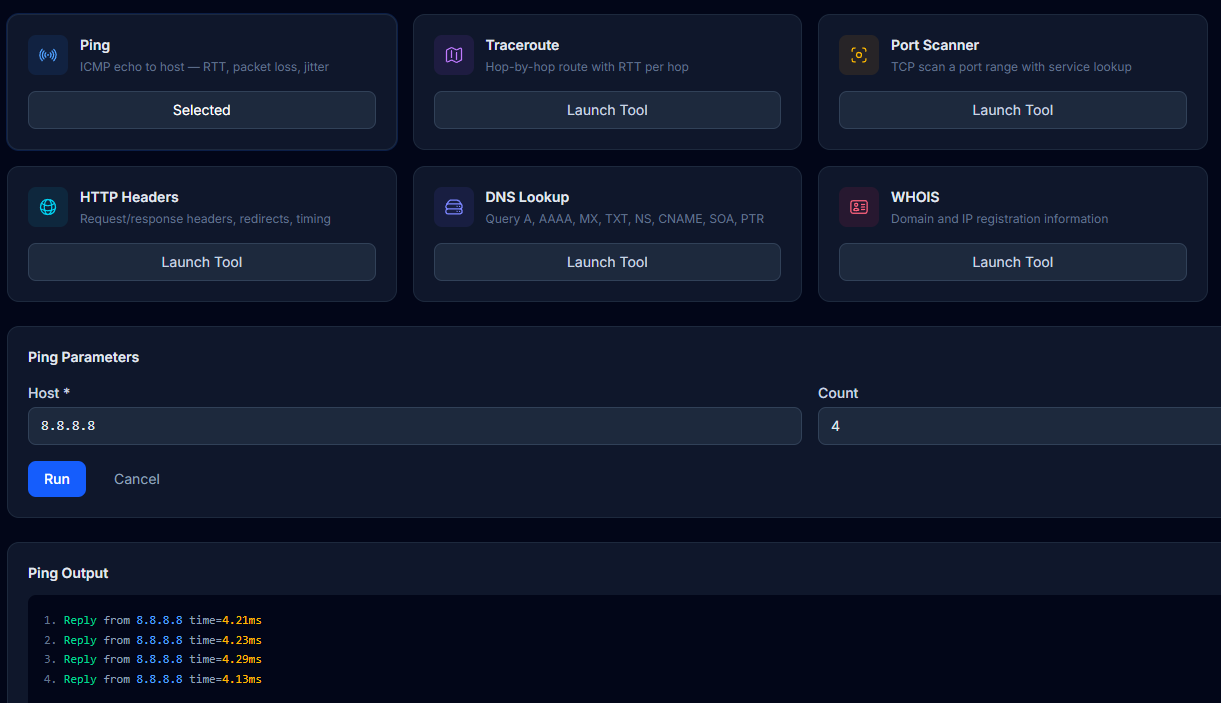
Diagnose issues without leaving the platform
Ping, traceroute, port scan, DNS lookup, SSL check, WHOIS, and HTTP header inspection -- all from the browser with live streaming results. No more SSH sessions just to run a traceroute.
- 7 diagnostic tools with live streaming results
- MIB manager with upload, parsing, and dependency resolution
- Subnet scanning with auto-import of discovered devices and services
Ready to stop guessing?
Deploy in MinutesBuilt from real MSP experience
We run an MSP. We built the monitoring tool we actually wanted to use. Every feature exists because we needed it in the field.
Scoped Client Views
Give each client their own view without spinning up separate instances. Per-client logins, dashboards, and device groups -- all from a single install.
White-Label Ready
Present it as your own monitoring platform. Self-hosted on your server, your domain, your branding. No third-party logos or vendor lock-in.
Rapid Deployment
New client? New server? Running in minutes, not days. One install command sets up everything, creates your admin account, and activates your license automatically.
"We built ACS Monitor because the tools we used were either too complex, too expensive, or required days of setup just to get basic monitoring working. We needed something that an engineer could deploy in minutes and a client could actually understand."
-- The ACS Monitor Team
Built by MSPs who got tired of the alternatives.
Try it FreeDeploy with a single command.
One command handles everything. Sign up, paste the install command, and you're monitoring.
curl -fsSL https://acsmon.com/install/<token> | bash
Prefer a full install? Download our ISO installer — boot from it and install everything including the operating system. No existing server required.
Create Account
Sign up and verify your email. Takes 30 seconds.
Add a Server
Name it, set your admin credentials, pick a tier.
Paste & Go
Run the one-line command. Monitoring is live in minutes.
The installer handles
Supported: AlmaLinux 9.x, Ubuntu 22.04+. Minimum: 2 CPU cores, 4 GB RAM, 20 GB disk.
Simple pricing. No surprises.
Start free. Upgrade when you need to. No hidden fees, no per-device gotchas.
Simple, predictable, no-nonsense licensing.
Free
Up to 100 devices & monitors
- All monitoring features
- Custom dashboards
- Alerting & notifications
- Support tickets & feedback
- No credit card required
Pro
Up to 500 devices & monitors
- All monitoring features
- Custom dashboards
- Alerting & notifications
- Support tickets & feedback
Enterprise
Up to 1,000 devices & monitors
- All monitoring features
- Custom dashboards
- Alerting & notifications
- Support tickets & feedback
Custom
Custom cap & pricing
- Unlimited device cap
- Tailored pricing
- Priority support
- Dedicated onboarding
- Support tickets & feedback
Device and service monitor counts are combined. All tiers include every feature -- the only difference is capacity.
Reviewed by the community
Frequently asked questions
Straight answers. No marketing waffle.
ACS Monitor is a self-hosted network and infrastructure monitoring platform built by MSPs, for MSPs. It combines SNMP device monitoring, service checks, website monitoring, auto-discovery, multi-channel alerting, and built-in network diagnostic tools into a single platform that deploys on your own Linux server with a one-line install.
ACS Monitor polls SNMP devices (v1/v2c/v3), runs 11 service monitor types (HTTP, Ping, DNS, SSH, SMTP, TCP, FTP, POP3, IMAP, MySQL, HTTPS), monitors websites for uptime, response times, SSL expiry, and content changes, auto-discovers networks, receives SNMP traps, and ingests webhooks. It also includes built-in diagnostic tools like traceroute, port scanning, DNS lookup, SSL checks, WHOIS, and HTTP header inspection. All from a single self-hosted platform.
Managed Service Providers (MSPs) who monitor multiple client networks, and IT teams who need self-hosted monitoring without cloud dependencies. Per-client scoped views, one-command deployment, and white-label hosting are built specifically for MSP workflows. If you manage infrastructure for other businesses, this is built for you.
Under 10 minutes from sign-up to live monitoring. Create an account, add a server, and paste one install command. The installer handles all services, database, admin account creation, and license activation. You will be adding devices before your coffee gets cold.
AlmaLinux 9, Rocky Linux 9, RHEL 9, Ubuntu 22.04+, Debian 12+, Fedora 38+, CentOS 9 Stream, and Raspberry Pi OS 12+ (ARM64). The installer auto-detects your OS, installs all dependencies, and configures everything automatically.
Your existing monitoring continues without interruption. You just cannot add new devices or monitors until you upgrade or remove some. No data loss, no downtime, no surprises.
Yes. Scoped user views let you create dedicated accounts for each client, locked to specific device groups and dashboards. Clients log in and see only their own infrastructure, alerts, and search results. You can also create per-client notification channels.
Completely. ACS Monitor is self-hosted on your own server. Your monitoring data never leaves your infrastructure. The only communication with our platform is periodic license validation and anonymous usage heartbeats (device count, monitor count, app version).
Email, SMS, Slack, and custom webhooks. You can configure per-channel and per-device notification rules, set up escalation chains, and receive recovery notifications when issues resolve. Each notification includes the device, metric, threshold, and severity level.
Yes. 25 widget types including charts, gauges, status grids, heatmaps, alert feeds, SSL trackers, and more. Drag-and-drop layout with auto-saving, auto-refreshing data, and shareable via unique links -- no login required for viewers.
All tiers include access to full product documentation, support tickets, bug reports, and feature requests. Requests are handled on a first-come, first-served basis. Custom tier customers may have bespoke support arrangements agreed separately.
Yes. ACS Monitor includes a full REST API with token-based authentication. You can manage devices, monitors, alerts, and diagnostic tools programmatically. The API supports all CRUD operations and integrates with your existing automation workflows.
Yes. The Free tier includes up to 100 combined devices and monitors with no time limit, no feature restrictions, and no credit card required. Every monitoring feature is available on every tier -- the only difference between tiers is capacity.
Stop firefighting. Start monitoring.
Deploy ACS Monitor in minutes. Free for up to 100 devices. No credit card needed.
100 devices free forever. No credit card required.